Hopey Posted November 8, 2012 Posted November 8, 2012 Hiya. (I hope this is in the right forum, I almost put it in the LDD etc one, but it didn't really seem to fit) I'm a programmer and AFOL looking for something of a hobby programming project, and I'm thinking about working on a Lego brick recognition application (or library). Jumping right to the point, imagine if you could throw a handful of parts onto a sheet of paper, take a photo of it, and have a program list precisely identify each part. The two most obvious applications of this would be automatically taking inventory, or as part of an automatic sorting machine. I've done a bit of googling, and I'm not entirely breaking new ground here. Several folks have done this before (such as , unfortunately his website's in Japanese), but there doesn't appear to be anything publicly available, so I'm thinking of starting my own.I've also done some reading on the technical side of it. The first step would be to extract the silhouette of the part (possibly from several angles), which I believe can be done using OpenCV; I think this bit would be relatively straightforward, though not without its difficulties. The next step would be using a database of the 3d models of parts (such as that used by MLCad) and determine which part most closely matches. This is by no means an easy task, but there is at least some literature on the subject. One could also possibly use the colour and weight of the part to narrow down the search. And that's it basically. There's a huge amount of technical details that would need to be addressed, such as dealing with overlapping parts, partially assembled parts, very similar parts, parts with decals, etc, and also making sure it's efficient enough to not require a supercomputer to do the detection in a reasonable amount of time, but hey, if it was easy it wouldn't be a challenge. Maybe there's some parts it can't do, no big deal. The plan is to do it incrementally. Maybe the first version will only recognise one part at a time, from only a small subset of parts, and require them to be in a specific orientation, and later more features would be added. I'm going to go ahead and assume that if something like this existed, at least some people would be interested in using it; the questions I have at the moment are: Am I re-inventing the wheel here? Has this already been done by someone that I'm unaware of? Are there any experts in image recognition floating around, or does anyone know of any they could point me in the direction of? Is anyone interested in collaborating with me on this? I'll probably go ahead with it regardless, but I'd like it to be more of a collaborative effort, preferably from someone with some experience working on open-source projects, if only in an advisory role. FWIW, I plan on doing it in C++, as I'd like to get a bit more experience with it (my speciality is Java). Cheers! Quote
legolijntje Posted November 8, 2012 Posted November 8, 2012 That sounds like a very cool project It would be so nice to just turn on the machine, put a pile of bricks in it and go watching tv. Whn I come back, I only have to quikly check it (I assume it can never be 100% correct)and then I can store it in the correct drawers. I'm still a beginner programmer and I defenitly don't have any experience working with open-source, I only know some (very) basic things of visual basic and java(script) and I'm very slowly learning things using Visual Studio 2012. (I do know html and css and a bit intermediate asp/aspx, but they are more for the web). I would like to help if you want, but I'm not sure how? Maybe, I assume you need a special lego construction (moc) for this? And as you said you want to make this publicly available, I can maybe build the digital model for it, it's a strong point of me (look at my signature ). Quote
Hopey Posted November 8, 2012 Author Posted November 8, 2012 ...I assume you need a special lego construction (moc) for this? I'm really not that interested in building a sorting machine (out of Lego or otherwise), at least not at this stage. To clarify, the scope of what I'm planning is software that takes an image and lists the parts. There might be a thin wrapper around it that connects it to a webcam or whatever, but for the most part it will be a library that anyone can integrate into their own software. The point of making it open is to encourage this, so that people with more parts and building experience than me can build sorting machines and whatnot. I'm not sure how you might be able to help at the moment. What does the "LDraw Indexer" logo in your avatar mean? Assuming I use the LDraw parts library for the 3d models, I'll definitely need the advice of someone who knows the details of the format; I've not looked into this at all yet. Quote
happymark Posted November 8, 2012 Posted November 8, 2012 I like the idea! actually I was thinking to make one *much* simpler one - LEGO minifigure recognition apps. so basically like Google goggles apps, you take a photo on one minifigure (either head or torso or a whole), then it will tell which figure it belongs to . Quote
freakwave Posted November 8, 2012 Posted November 8, 2012 What about of using a kinect to do it? Quote
Hopey Posted November 8, 2012 Author Posted November 8, 2012 I like the idea! actually I was thinking to make one *much* simpler one - LEGO minifigure recognition apps. so basically like Google goggles apps, you take a photo on one minifigure (either head or torso or a whole), then it will tell which figure it belongs to . Yes, something like that. I hadn't actually thought of minifigures, which pose several problems: - differentiating parts from the same mould with different stuff printed on them, such as minifig heads & torsos - multi-part parts, with moveable joints. I've assumed that you'll need to have the parts disassembled, but a "disassembled" minifig torso still has its arms and hands. How will I identify a minifig torso with an arm missing? Or with its arms up in the air? Or with legs bent? etc. Oh well, these are the challenges I'll have to get to. What about of using a kinect to do it? I don't think it'd be worthwhile, as all it could really help with is determining the silhouette, which I think I can do fairly easily in OpenCV. Also, I don't have one :) Quote
Darkdragon Posted November 8, 2012 Posted November 8, 2012 Sounds like a good idea to me! If I was doing it, I'd try and make sure I built it with a phone/table version in mind too. This way, for example people could use it at a meeting if someone says "hey what's this part?" and just snap the pic right there in the app. A full C++ desktop version is good plan though, so much more powerful with room to expand and add so many features (my head is already filling with ideas). Quote
davee123 Posted November 8, 2012 Posted November 8, 2012 (edited) Seems like a pretty difficult undertaking, especially considering that even humans have trouble recognizing particular elements and colors in a pile of pieces. The creation in your link would be far simpler by comparison-- you don't have to deal with camera angles, lighting, or fish-eye factor of the lens, let alone overlapping pieces. One nice thing about requiring the elements to be separated is that they'll *typically* orient themselves in a particular position. You're more likely (for example) to find a 1x1 plate resting on its stud or on the base-- not too likely that you'd randomly see it positioned on its side. But when you allow for overlapping elements, then the orientation can be widely varied. Colors are another issue-- you'll have to distinguish things like shadows, color changes, prints, etc. and also determine what the appropriate color is, depending on the camera. If you're planning on making it open-source, you'd likely want to calibrate the camera with a "fixed" few elements-- IE, the image always has to have a stack of 2x2 bricks, with white at the top, then red, then yellow, then blue, then black. Or whatever. But something to help the software detect what the lighting conditions are. I would try and start small. Write something that can individually identify various sizes of bricks-- 1x1, 1x2, 1x3, 1x4, 1x6, 2x2, 2x3, 2x4, 2x6, or some other similarly small list. Then try identifying particular known colors. And then try some harder-to-identify items like slopes, printed minfig heads, etc. DaveE Edited November 8, 2012 by davee123 Quote
Hopey Posted November 8, 2012 Author Posted November 8, 2012 Sounds like a good idea to me! If I was doing it, I'd try and make sure I built it with a phone/table version in mind too. This way, for example people could use it at a meeting if someone says "hey what's this part?" and just snap the pic right there in the app. A full C++ desktop version is good plan though, so much more powerful with room to expand and add so many features (my head is already filling with ideas). Yes, possibly in the future, but I don't want to start writing different versions for different platforms just yet. I really don't know how much processing power is going to be needed, and it may well not be practical to do it entirely on a mobile device. However, with a C++ library, it would be straightforward to write apps for various platforms which simply take a photo, maybe do some pre-processing of it, then upload the result to an internet server which does the processing and returns the parts list. That's a long way off though. Seems like a pretty difficult undertaking, especially considering that even humans have trouble recognizing particular elements and colors in a pile of pieces. Absolutely. I don't intend for it to be able to deal with a pile of mixed pieces, or assembled pieces. It may be possible, but that's a goal for a long time in the future. The requirement will be that the image consists of pieces laid out with some minimum gap between each piece. For now, I'm assuming that a human will disassemble the pieces, and either a human or some simple device will lay them out, but the exact nature of how this is done is beyond the scope of what I'm planning. The creation in your link would be far simpler by comparison-- you don't have to deal with camera angles, lighting, or fish-eye factor of the lens, let alone overlapping pieces. One nice thing about requiring the elements to be separated is that they'll *typically* orient themselves in a particular position. You're more likely (for example) to find a 1x1 plate resting on its stud or on the base-- not too likely that you'd randomly see it positioned on its side. But when you allow for overlapping elements, then the orientation can be widely varied. I'm note even going to attempt to do overlapping pieces. As for orientations, this becomes a question of which is the easier task; implementing a system that can identify a piece from any angle, or or calculating (or entering) all possible orientations that each piece can have and implementing a system that can identify them more easily using that information. Time will tell. The system in the video can also use the weight of the piece, since they are delivered one at a time. Colors are another issue-- you'll have to distinguish things like shadows, color changes, prints, etc. and also determine what the appropriate color is, depending on the camera. If you're planning on making it open-source, you'd likely want to calibrate the camera with a "fixed" few elements-- IE, the image always has to have a stack of 2x2 bricks, with white at the top, then red, then yellow, then blue, then black. Or whatever. But something to help the software detect what the lighting conditions are. Yep, determining the colour won't be a trivial task either. To be honest, I'll need to do some research on colour spaces and colour calibration. I like the idea of there being a standard calibration model that you would build and take an image of, say 4 1x2 bricks in red, green, blue and white. It's an open question to me at the moment whether I'd need a sample of every colour in order to do the calibration. But to be honest, determining the colour is a low priority for me at the moment. I would try and start small. Write something that can individually identify various sizes of bricks-- 1x1, 1x2, 1x3, 1x4, 1x6, 2x2, 2x3, 2x4, 2x6, or some other similarly small list. Then try identifying particular known colors. And then try some harder-to-identify items like slopes, printed minfig heads, etc. That's the plan :) Quote
ShaydDeGrai Posted November 8, 2012 Posted November 8, 2012 I think one of the first questions you need to consider is whether you want to try to solve this problem in a spatial domain, a time domain or take a hybrid approach. A spatial approach is looking for artifacts in the image as YOU see the image; thing like matching an outline or a profile to count studs to get lengths (knowing the size of the stud in real life) the problem is that the more you move away from an orthographic (exact 90 degree shots from left, right, front, back, top and bottom) projection, things get messy. Add to that, lighting conditions, partially obscured parts (or self-obscuring, concave parts) and things can get ugly fast. A temporal domain starts with ugly math and non-obvious concepts but can render as moot a lot of issues like scale, lens distortion and perspective foreshortening. A hybrid approach, as the name implies, tries to find the best of both words Personally, I'd probably start with the temporal domain. Using LDraw wireframes, you can build up a database of ideal images of parts. I'd use either a Fourier Transform (floating point) or a Walsh transform (binary - less accurate but faster) on these images to get their temporal projections. (A book on Numerical recipes can be useful here but there are plenty of open source FFT code samples to draw from). When you take an image of a real part, do an edge detection, throw away the color information, and transform what's left (a good book on image processing can help here if you need algorithm ideas). Then perform a convolution on this reduced image with each of your reference images. Convolution in the temporal domain works a bit like waves in a ripple tank, the super-positioning of waves with different periods and frequencies tends to cancel things out and you're left with lots of noisy ripples, but if the waves match, the signal intensity doubles and you get one big wave. In essence this gives you a way to measure how similar two images are to one another and, by extension, which ideal image best matches the sample. Since, under this scheme you're never looking for an "exact" match, only a "best" one it's more forgiving of photographic artifacts. The down side, of course it that it's a lot of computation and a smarter algorithm would probably be to try and match features of the brick (studs, tubes, clips, etc) in isolation first, to narrow down the number of parts you need to compare it to (hint: round things are easier to track in a temporal domain, straight lines are more distinct in the spatial world) I hope I haven't made your eyes glaze over (I used to do this stuff for a living and studied image processing under the guy who cleaned up the Hubble telescope images back before the fixed the lens) I know I sometimes forget other people may have social lives and don't use terms like Convolution and Fourier Transform in casual conversation. Good luck with your project, it sounds like it could be fun. Quote
Hopey Posted November 8, 2012 Author Posted November 8, 2012 ... Thanks for your input, it's great to know that there's someone knowledgeable around. I briefly studied Fourier transforms at uni, and although most of it's fallen out of my brain since then, I think I get the general idea. I'm currently learning the opencv library, which is capable of doing most if not all of what you've described, and can certainly do Fourier transforms of one type or another. I think I'll try and implement it in such a way that I can swap different algorithms out, if that's at all possible, and use the "best" one after some experimentation. I imagine it'll be a two-step process. I haven't fully thought this through, but I'm thinking that if I can get a reasonable scale calibration, then I should be able to estimate a cuboid bounding box spatially, and only compare against parts with a similar size, i.e. if the part is 1x2x5 studs, then I only need to compare it to parts that are (approximately) that size. A quick question that comes to mind: how does rotation impact the convolution of the transformed images? i.e. if I transformed and convoluted an image, and the same image rotated say 30 degrees, would it still 'match', or would I need to do some other operation as well? Thanks for the help, you certainly haven't made my eyes glazed over :) Quote
Phoxtane Posted November 8, 2012 Posted November 8, 2012 I saw akiyuky's brick sorter a while back, and I tossed the idea around with a friend about how we would go about creating one. It boiled down to a few key points: - The background against which the bricks are going to be examined must be a neutral color, and evenly lit. akiyuky was able to do this with a paper/vinyl final conveyor and some LEDs in an enclosure. - He looked at only one brick at a time, using two conveyor belts running at different speeds to spread out the bricks. Even then, the system took a while to find the part it was looking for out of the few hundred that were in the database. Something to keep in mind, I suppose. - A scale was used to check the brick's weight. This should help in the sorting process. And finally, we came to the issue of teaching the database to have a general idea of what the various bricks look like from different angles. It was quickly decided that taking a picture of the bricks we wanted to try out from quite a few angles, and then moving them to the computer for analysis would be overly time-consuming. That's why we decided we'd search for pictures of the bricks online for use in the teaching process, and create LDraw renders of the bricks that we would be unable to find online. Eventually, the idea was to be able to automate the entire teaching process by creating a script that would create renders of a brick from all of the required angles that the database needed, then feed those into the database. I'll admit it was overly ambitious, since no such device has been assembled by either of us. Quote
ShaydDeGrai Posted November 8, 2012 Posted November 8, 2012 A quick question that comes to mind: how does rotation impact the convolution of the transformed images? i.e. if I transformed and convoluted an image, and the same image rotated say 30 degrees, would it still 'match', or would I need to do some other operation as well? There are actually two type of "rotation" to consider, one where the information content of the image hasn't changed and one where the underlying image conveys a fundamentally different story. Let's say I put a 2x2 plat on the table and photograph it from directly above, I can see the studs and the edge of the piece, for argument sake, lets say the edges are exactly parallel to the edges of the photo itself now I spin the piece on the table but still photograph it from directly above, I get an image where the edges aren't parallel to the edges of the photo any more, but if I printed out both photos on acetate and helf it up to the light I could rotate the two printout and get the image of the plate to align. The important part of the image (the information) is the same, it's just the orientation within the sampling area that was impacted by the rotation. This sort of rotation is easy to detect and compensate for when using FFTs. If you look at the Magnitude of the transform of a box (our piece in this case) and apply a threshhold filter, you'll get a blurry plus (+) sign image that eventually reduces down (depending on where you set the threshold) to a dotted line along the dominant axis of the box. So if your box is taller than it is wide and perfectly aligned with the edge of the frame you should see a vertical dotted line appear in the reduced plot. If the box is rotated, this dotted base line will also be rotated by the same amount with respect to the center of the image. From there you can calculate the angle, apply the opposite rotation matrix to the image and an inverse FFT will realign the original photo. Similarly, you can use a phase correlation filter to deal with issues of magnification or translation (say your photo is off center and magnified slightly). The strongest point of the phase correlation should get you the offset you need for a translation matrix operation and the signal to noise ratio in getting that strong point can clue you into difference of scale. The harder case is when the camera has moved such that the different rotation has a different perspective of the object (and potentially different information). When this happens you're often better off looking for features of an image rather than trying to match the whole thing at once. If I look down at the corner of a cube, for example, the two dimensional projection of its outline is a hexagon; If I look at one face dead on, I see a square. Without knowing that I stared with a cube, how do I know if I'm supposed to see a hexagon a square or something else entirely. Since we know we're looking for LEGO parts and they, as a general rule of thumb have studs and tubes (which are round, and round things are easy to spot in FFT projects even when skewed by perspective) I might try to write a "stud-finder" module and see how that does with arbitrary points of view in a few test cases. Once you know where the studs are you can figure out a) likely parts to compare to, and b) scale and perspective skew (because the studs are always circles of know size) to either massage the source image to make it more like your references, or generate new references that recreate the camera positioning used on the physical model. Quote
Hopey Posted November 8, 2012 Author Posted November 8, 2012 There are actually two type of "rotation" to consider, one where the information content of the image hasn't changed and one where the underlying image conveys a fundamentally different story. Yeah, I was referring to the easy case. My initial brute-force approach is going to be generating views of each piece from some number of angles all around it, then simply comparing the input image to each of them (using transforms as you've described) and returning the best match. If I can eliminate rotation about the Z axis (from the camera's frame of reference) then this should be possible. Once I get that proof-of-concept working, it's really just a matter of optimising it. Thanks again for the help; looks like I've got some reading to do... Quote
hrontos Posted November 8, 2012 Posted November 8, 2012 Taking into account what was written here, what kind of input images do expect to be supported? As Phoxtane mentioned, lighting conditions and multiple angles helped a lot in case of that mindstorms sorting machine. And as ShaydDeGrai mentioned, even to determine the orientation of the brick you should be able detect studs or other important points on images, but on standard images of some bricks on a table, you will not have enough details. OCR software is in principle doing similar in 2D, but again under certain strictly defined conditions. Of course such a library would be great even if it worked under some strict conditions - like in that minstorms example - this means, one brick at a time and "scanned" from more angles in controlled conditions. Quote
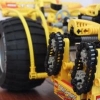
Hopey Posted November 8, 2012 Author Posted November 8, 2012 Taking into account what was written here, what kind of input images do expect to be supported? I'm not sure yet. Obviously there's going to be some constraints, but the less restrictive, the better. It all depends on how well I can get it to work. Initially, I imagine it will be rather restrictive, and I was even considering requiring 2 or 3 different angles, which would make allowing multiple parts to be identified trickier. I've been experimenting with opencv, and I've come up with stuff like this: This is just a very simple threshold filter, in suboptimal conditions, and yet I'd say it's enough to match the bent liftarm and probably the axle. The plate and brick highlight the difficulty (or impossibility) of identifying from a single angle, and I'm definitely going to have to have a think about backgrounds before it can recognise that white gear. The plan is to get it to recognise some objects in optimal conditions, then work to improve it. Better lighting would remove the highlights on the studs of the plate. An edge detection algorithm might find the gear a it better. Recognising studs might help differentiate tiles from plates. And so on. Rather than focus on all the problems I might run into, I'm hoping to just make something simple that works sometimes, then incrementally improve "sometimes". But I think that's enough for tonight :) Quote
ShaydDeGrai Posted November 9, 2012 Posted November 9, 2012 On a slight tangent, I recall one project I worked on that was supposed to use neural nets to recognize and classify US, British and Soviet tanks based on satellite and/or spy plane footage. We built the network, came up with all sorts of exhaustive training sets (with neural nets you try to get the computer to figure things out by example "this is a T-62, this is a Chariot, this is an Abrams, etc. and hope the network figures out what differences one from another when shown photos from all different angles, perspectives and levels of obscurity). We felt pretty good about the system in the lab, it had a 99% accuracy for identifying "ours" versus "theirs" and about a 60% accuracy on the actual model of tank. Then we fielded it and it failed horribly. In analyzing what went wrong we realized that all of our training photos for "our" stuff were professional, staged photos given to us by proud defense contractors and most of our Soviet samples were from field footage, spy cameras or frame captures from newsreels. When we correlated image quality with output we found that we had invented a multi-million dollar photo critic. If it was a nice clear, patriotic looking photo the system declared it to be a US tank; if it was a good quality photo but the sky looked overcast, it assumed it was a British tank, and if the photo was grainy, blurry or washed out, it got classified as a Soviet tank. My cat, who refused to sit still for the photo, was classified as a T-62. While Neural Nets are an interesting thing to play with, I'd recommend sticking with traditional image processing techniques for this project ;-> Quote
Hopey Posted November 10, 2012 Author Posted November 10, 2012 (edited) So it's coming along slowly, at the moment I'm just learning how to use the relevant parts of opencv, along with gtk. Also trying to unlearn the Java way of thinking so I can understand c++ properly :) A question for ShaydDeGrai (or whoever might know): I'm getting a little ahead of myself with this, but I'm thinking about how to optimise the search. Effectively, the process is going to be taking some representation of the input image of the part and comparing it against some representation of every view of every part. Needless to say, if done naively this will take an inordinate amount of time, so one thing I'm thinking of is somehow indexing them. Part of the process will be to take the ldraw parts catalog, generating views of each piece and storing them somehow (probably in a database). Is there some way of storing a simple numerical summary of each image? Something like a hash of it, but not a hash, as a hash function is chaotic, so similar images won't have similar hashes. Pseudocode along the lines of: function T summary(image) {...} //Building database: for image in generate_ldraw_images() { T summ = summary(image); insert into images (image, summ); } //Matching input: image = get_image(); T summ = summary(image); for dbimage in (select * from images i order by |i.summ - summ| limit n) { if(match(image, dbimage) return dbimage; } i.e, some relatively quick function I can run than calculates some metric of the image which is similar for similar images. I have no idea what such a function might be, how many dimensions the result may have (hence T above), or how I might calculate it. I may be asking too much here; it may be that the "order by" in the above has the same computational complexity as the simple brute-force comparison. But if such a thing exists (with temporal transforms and whatnot), it'd be very handy. An alternative is to do it in the spatial domain; Build some sort of tree consisting of stock images, starting at the top with simple shapes (a square, a circle, a 2:1 rectangle, etc), getting slightly more complex as it goes down, with the actual part images at the leaves. It wouldn't be a binary tree, there'd be several children of each node. Ldraw views would be inserted by making some comparison (in the temporal domain? I dunno) with the images at the each level, starting at the top, choosing the closest match at each point. The matching process (or at least the narrowing down of the candidates to compare with more scrutiny) would involve repeating this process with the input image. I'm not sure if it'd work i.e. if it chooses the wrong great-great-grandparent it'd never find the right part, and I'm not sure how I'd calculate the intermediate shapes, but I't be nice to get me some of that sweet O(nlogn) action. Either way, the plan is to do what I can to decrease the computation required to find a match, by increasing the amount of computation done when inserting the database images. Hopefully this'll work, time will tell. While Neural Nets are an interesting thing to play with, I'd recommend sticking with traditional image processing techniques for this project ;-> I had thought of the idea of trying to evolve a lego-recognising neural net, but given your anecdote, I think I'll steer clear :) As an aside, anyone know of a more specialist forum where I might discuss some of this stuff? Edited November 10, 2012 by Hopey Quote
Phoxtane Posted November 11, 2012 Posted November 11, 2012 I had thought of the idea of trying to evolve a lego-recognising neural net, but given your anecdote, I think I'll steer clear :) If it were me, I would leave in some sort of way for the user to correct the program and have it learn over time from that. Quote
ShaydDeGrai Posted November 12, 2012 Posted November 12, 2012 A question for ShaydDeGrai (or whoever might know): I'm getting a little ahead of myself with this, but I'm thinking about how to optimise the search. Effectively, the process is going to be taking some representation of the input image of the part and comparing it against some representation of every view of every part. Needless to say, if done naively this will take an inordinate amount of time, so one thing I'm thinking of is somehow indexing them. This is a very good question and I don't think it's ever too early to address it because how you organize your reference sets can really impact how well the entire system functions in the end. Years ago, I worked on a finger print matching system that faced many of the same issues. Our goal/expectation wasn't to find an exact match, at that time machine based matches weren't admissible in court but were used to create a short list of possible suspects for a human expert to consider matching by hand. We wanted to be able to reduce the search space from tens of thousands to hundreds as quickly as possible, so that when we did our second, more computationally expensive pass we could produce a list of our top ten or so candidates before all the suspects die of old age. (I just love it when, on CSI and such, they have a cheap laptop that can search the entire DoD, INS and FBI databases for a partial print and not only come up with an exact match in under a second, they render a spiffy real-time display of all 20 million comparisons just for good measure...) Anyway, the way we chose to simplify our first pass candidate reduction was to use borrow a idea from Information Theory called the Hamming Distance. The concept is named for Richard Hemming and to grossly over simplify things what it represents is, given two strings of equal length, the number of characters in the string that you need to change to make the strings identical. So, for example, the Hamming Distance (HD) between "CAR" and "CAT" is 1 (change R to T and you're done) Likewise the difference between "CAT" and "BAT" is one but between "BAT" and "CAR" is 2. If every string in the database is considered a node in a graph, then nodes with a Hamming Distance of 1 are considered adjacent, 2 would be two nodes removed, 3 becomes 3 nodes removed, etc. So if I were to organize my three word vocabulary at this point it would look like: CAR --- CAT --- BAT. If I were to add a 4th word, "BAR" it would be adjacent to both CAR and BAT but two steps removed from CAT. As you can probably guess, building up this graph takes time and ultimately means comparing each new entry in the database to every other entry in the database. This is the trade off, a (potentially large) one time expense in exchange for significant speed ups at run time. What we did with the finger print database was to come up with a binary string of "features" where individual bits indicated "has this feature or not" and small groups of bits represented binary enumerated "buckets" of ranges for scalar values (ie. "00" means none; "01" means 1-3; "11" means 4 or more - note that the binary patterns are Hamming Codes themselves, there is no "10" because it would have the same HD as "01" when compared to the other bit patterns in the set.) This simplified encoding allowed us to give every reference a (in our case 128bit) signature. Comparing signatures was in assembly code and fast (XOR the two binary values, bit shift through the result counting all the 1's that fall off the end, the total number of 1's is the HD. Patterns that map to the same signature string have a HD of 0 and, assuming you came up with a good signature scheme should be very similar to one another, Those with a HD of 1 only differ by one attribute and might be worth checking if the distance 0 search comes up sparse or empty, etc. The signature strings became our hash keys, and a B-Tree structure was used to deal with hash collisions (because in our case, we WANTED hash collisions, if things mapped to the same point, it meant we were getting close). Each node in the B-Tree had a list of all of its adjacent (HD=1) nodes to assist in a secondary search if need be. Of course all this is predicated on coming up with a good "signature" string. The first temptation is to copy something like Bricklink's taxonomy; I think they have about 200 different brick families ("Brick,Modified","Technic, Axle", "Animal, Body Part", etc.) The problem with this approach is that it assumes you know something about the context of the part your trying to identify, which might not be true. Going back to fingerprints for a minute, we expressly DIDN'T use the fact that some prints on file came from known felons and other came from trusted people holding security clearances because if someone just hands you a print and says "match this" without telling you whether it came from a crime scene or the White House, initially limiting the search to one demographic or another might actually hamper the overall search effort. The trick to coming up with a viable signature is to focus on testable and countable attributes. Figure out, based on your image processing efforts, what you can learn about any given piece easily. For example, does it have studs? If so, how many and do they form a row, a rectangular grid or an irregular pattern? Does it have studs on more than one face? Are the studs hollow? It it wider than it is tall? Does it have flat sides? etc. One of the early explorations into Artificial Intelligence was a simple game game called Animal. The idea was that the system would build up a decision tree, trying to guess an animal based on a series of questions and asking for more differentiating questions each time it guessed wrong. Over time, it was theorized, it would become an "expert" system. The dialog went something like this: PLEASE THINK OF AN ANIMAL AND I WILL TRY TO GUESS IT. DOES IT SWIM? >no (human input) IS IT A BIRD? >no I'M STUMPED, WHAT WAS IT? >a cow PLEASE ENTER A QUESTION THAT WOULD DIFFERENTIATE A COW FROM A BIRD: >does it give milk? (...) The next time the system ran, and the user said the animal didn't swim, rather than guess bird, the system would ask if it gave milk. If so, it would guess cow, otherwise it would guess bird. This is the sort exercise I think you need to consider when coming up with the "signature" for classifying your reference cases; broad yes/no questions based on easy out-of-context observations and measures that rapidly reduce the search space. If the cross sectional area if greater than the height on a part with studs, it's probably a plate rather than a brick. If the volume of the convex hull significantly less than the that of the bounding box, chances are good that you're dealing with a slope or a bow. If the studs are hollow and the side walls have holes in them, it's probably in the technic family. If the piece barely has any recognizable aspects, its probably either a minifigure accessory or a Bionicle part. Figure out what questions to ask for any given part you hope to recognize and encode the answers to those questions into the "universal" signature string. Again the finished signature doesn't have to be _unique_ it just needs to map similar parts to the same base index and, more importantly, take clearly dissimilar parts out of the competitive range as quickly as possible. Again, I hope this helps and I apologize to any non-techno-geeks whose heads may have recently exploded from this discussion ;-> Quote
Hopey Posted November 12, 2012 Author Posted November 12, 2012 Thanks, this gives me plenty of lines of enquiry for when I get to doing the indexing, although I think I'll aim for a correctly identifying from a small set slowly first, then use indexing and such to improve it. I'd never have guessed that such a technical discussion would bring up so many interesting anecdotes :) I'm currently investigating using fourier transforms for the comparison, and I'm not quite sure what I need to do next. I apply some filters to get a nice clean image (experimenting with blurs, edge detection, thresholds, back projections) then do a FFT. I end up with 2 matrices, the magnitude and the phase. If I normalise the magnitude to the grayscale range and use it as an image I see the typical cross pattern. However, all the things I've read about it have pretty much stopped at this point with a "look at the pretty pictures" and talk about the patterns that are visible, without doing any further computation. How do I go about extracting some useful information from the image from it's fourier transform? Do I do things like edge detection on the transformed data to find the strongest axes and whatnot? I'm finding this all very interesting, although I'm getting a little put off by the fact that most of the results for most of the searches I've been doing have been abstracts from Phd theses, grant proposals and other higher academic stuff. So I might be in a little over my head, but will persevere :) Quote
ShaydDeGrai Posted November 12, 2012 Posted November 12, 2012 However, all the things I've read about it have pretty much stopped at this point with a "look at the pretty pictures" and talk about the patterns that are visible, without doing any further computation. How do I go about extracting some useful information from the image from it's fourier transform? Do I do things like edge detection on the transformed data to find the strongest axes and whatnot? I'm finding this all very interesting, although I'm getting a little put off by the fact that most of the results for most of the searches I've been doing have been abstracts from Phd theses, grant proposals and other higher academic stuff. So I might be in a little over my head, but will persevere :) I can appreciate that, when I was in grad school I knew this one Russian kid that could solve any formula you dropped in front of him, he'd just chew through the ugliest, most cryptic multidimensional formulae you could imagine but if you asked him what any of it actually meant he'd just shrug; he loved the math but couldn't explain it or related it to the real world. I was just the opposite, loved the concepts, new how to set things up in a computer to get practical results, by my eyes rapidly glazed over once the equations started looking like Sanskrit tablets. Anyway, there's a few things you can try to play with that goes a little beyond looking at the "pretty pictures": In an FFT magnitude plot, play with thresholding, that is to say above a cetain value is white, below it turns black. This gets rid of a lot of the noise in cross pattern and in many cases (depending on what the original image was) may reduce to a cross made out of distinct dots - one row vertical, one row horizontal. The longer row will give you the dominate axis for the part (you can do this by finding the actual dots, or since everything that isn't a dot is black, just up the threshold level until all the dots fit in the image area and find the bounding rectangle of the dots. Also, if the original part is rotated by say 30 degrees, you'll be able to see this in the rotation of the dotted cross. If you write a program to play connect the dots (basically placing two lines on the image such that every dot in the thresholded image is touched by at least one of the lines) you can reverse engineer a rotation matrix to digitally "undo" the rotation of the original image. Apply the rotation matrix to the (unadulterated) FFT then take and inverse FFT you should see (more or less) the subject in the original image "straightened" to align with the frame of the image. This can be useful pre-processing to make your sample images line up with your reference photos as much as possible. A good starting point for something more complex is "convolution." Conceptually it's a little easier to understand in two dimensions (time magnitude) like a line chart than three (x,y,magnitude) like a gray scale image, but if you "get" the 2D case you're on the right track for coding up the 3D one. The idea is that one function (curve) is a fixed plot, say a simple square step function: f(t) =1 if 0<=t<=1, 0 otherwise and that another curve has a fixed shape, but can slide along the 't' axis, ideally starting from negative infinity to positive infinity. The correlation between the two functions is the plot of the the two functions common area under the curves with respect to time. For argument's sake let's say both waves have the square form shape described above. So if you can imagine one 1x1 box fixed on an axis while another 1x1 box comes sliding along, initially they don't overlap at all, for the convolution plot is zero, then, as the move over each other, the convolution ramps up linearly as overlapping area is strictly a function of the horizontal position of the sliding box, the correlation plot will peak then the two shapes exactly overlap, and then decline linearly as the sliding box moves off to infinity eventually bottoming out at zero again as the two curves no longer share any area. The same concept extends to three dimensions but now you have to move one array across another array (or if you're really lucky, just calling the correlate function of your library and letting it do the heavy lifting) Once you're comfortable with this, one "locator" operation you might want to explore is the "Phase Correlation" function. This take s the FFT of two images and finds the peak energy (max value) of the cross correlation between them, in English what this means is that it finds the offset from the upper left hand corner of the second image where, if the two images are laid on top of one another, they are most similar. Like the example of the two square functions sliding on the axis, it's looking for the point where the common area (magnitude) between two plots is maximized. Since you're looking for a maximum not an exact value, this allows you minimize the impact of a lot of issues like differences of scale, translation, shading, etc. that you'd normally have to deal with in the normal spatial domain. Another interesting exercise is to compare the "Cross correlation" of two images with the "Auto-Correlation" (an image crossed with itself) of one of the two sources. At the risk of resorting to formulae: If I have a reference image R(x,y) and a sample image S(x,y) I can compare the convolution(*) of R*S over all of x,y and compare it with R*R. The closer R*S is to R*R the more the inverse FFT of S resembles the inverse FFT of R. So if I have, say, five reference images and one sample one, by minimizing the magnitude of the difference between the cross-correlations between each reference an the sample with the autocorrelation of each reference I can pick the reference image that best matches the sample without actually identifying any elements with the images themselves (it's a sort of "all pairs" comparison, computationally expensive, but easy to set up with the right numerical methods cookbook.) If you want to get fancier, you can start to combine the techniques. For example, you can synthesize a picture of a LEGO stud (no brick just the stud) get it's FFT and then correlate that with the FFT of the sample, instead of a single peak value (like we had when the square waves exactly overlapped) we now get peaks each time the cross correlation finds a stud in the sample image. If we use a threshold function on this, we should be able to get one dot for every stud detected and (depending on the inner workings of your 3D correlation method) there should be a linear relationship between the locations of those dots in the thresholded image and the positions of the studs in the original picture. You could do the same thing, looking for rectangles (brick sides) or triangles (gear teeth) but since FFT are based on modeling things with sine waves, the biggest bang for your buck will come from looking for things that are round. (Use spatial edge detection to look for sharp lines, temporal correlation to look for curves). Have fun. Quote
Hopey Posted November 12, 2012 Author Posted November 12, 2012 ... Have fun. Thanks, I appreciate the time you've put into helping me out with this. I think I've got enough now to keep me busy for quite a while... Quote
Phoxtane Posted January 23, 2013 Posted January 23, 2013 Is this project dead? I would have loved to see it completed... Quote
Recommended Posts
Join the conversation
You can post now and register later. If you have an account, sign in now to post with your account.